Desktop statistical software · Beta
One workspace for statistics, quality and experimental design
HypoNum brings data preparation, exploration, statistical modelling, process quality, designed experiments and time series together in one desktop application, with every step recorded so your analysis can be reproduced.
Seven analysis families. One application.
Move from a first plot to a capability study, a designed experiment or a forecast without exporting your data to another tool.
Explore
Examine distributions, patterns and relationships graphically, with plots linked to the rows behind them.
Statistics
Estimate, compare and model: tests, linear and mixed models, multivariate methods, survival and more.
Survey
Summarize a survey design and examine the consistency of scale items.
Time Series
Study ordered observations, cross-correlation and forecasting, from ARIMA to VAR and GARCH.
Quality
Monitor a process, assess measurement systems and capability, and study reliability and acceptance sampling.
Design
Plan experiments, sample sizes and prospective power, then analyze the results with the design’s model.
Predict
Apply retained models to new tables and examine their predictions and response profiles.
Built for analysis you need to stand behind
The work behind a conclusion stays with it: the data, the steps, the settings and the result.
01
Every project is reproducible in Python
A project exports as a readable Python script built from its recorded workflow. Rerun the whole project, or a single result and its prerequisites, from the command line.
02
Native Python plug-ins
Add your own analyses to the Plug-ins menu. A plug-in gets a setup form and returns tables, values and plots inside HypoNum.
03
Many tables, one project
Keep related datasets in tabs and save them together with their preparation steps and the results you chose to retain.
04
Measurement standards you can govern
Gage studies follow the AIAG MSA 4th edition standard. Define your company’s own profile, and every saved result records the settings it used.
05
Saved results know their source
A retained result is a snapshot of the data it used. If that data changes later, the result is marked so you can decide whether to rerun it.
06
Reports ready to share
Assemble results and notes into a report and export it to HTML, PDF or editable LaTeX.
Quality engineering
A complete quality toolkit, not an add-on
Control charts, measurement-system studies, capability, acceptance sampling and reliability sit beside the rest of your statistics, using the same data and the same project.
Explore quality tools →- Shewhart, CUSUM, EWMA and moving-average charts
- Short-run and multivariate monitoring
- Crossed and nested Gage R&R
- Type 1, linearity, bias and stability studies
- Attribute agreement
- Normal, non-normal and batch capability
- Acceptance sampling by attributes and variables
- Tolerance intervals and reliability analysis
149 / 149
reference cases met their acceptance criteria
Checked against published references
The completed September 2026 reference assessment contains 149 distinct input-and-setting cases, and all 149 met their specified acceptance criteria. It concerns selected calculations in a pre-release version; further reviews are in progress.
Read what was assessed →And everything you expect
Import
CSV, TSV and text files, Excel workbooks, and read-only queries of SQLite and DuckDB databases.
Prepare
Duplicates, missing values and outliers; split, concatenate, merge, stack and pivot; formula columns.
Plot
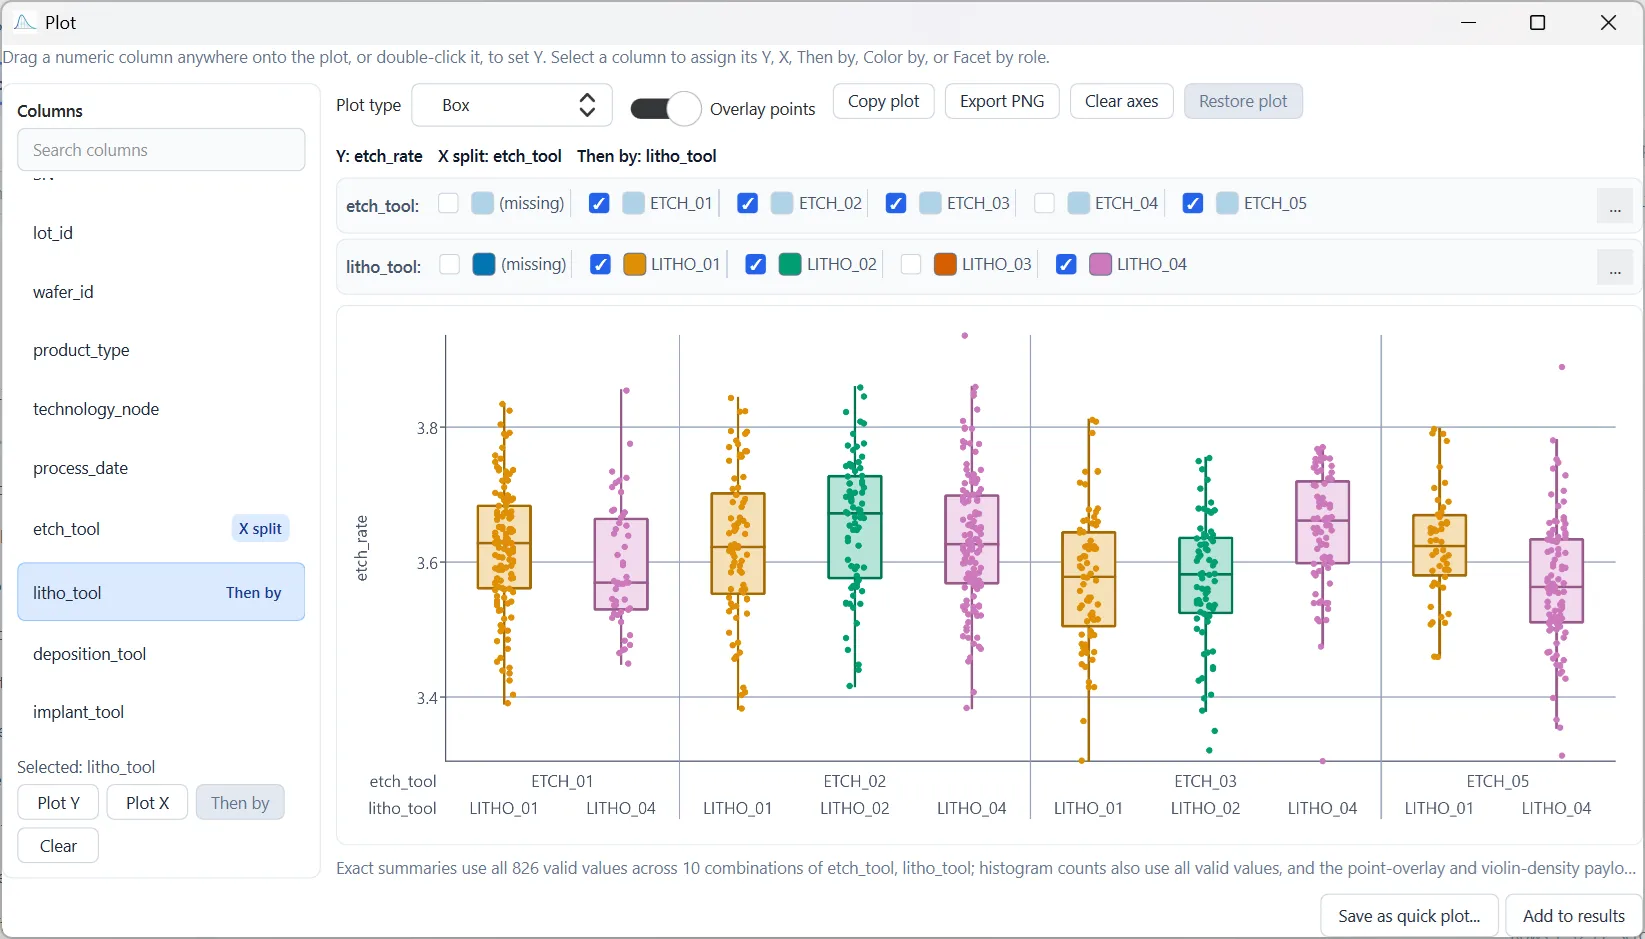
Box, violin, histogram, scatter, Pareto, heatmap and cumulative distribution plots, linked to your rows.
Work comfortably
Undo and redo, row exclusion without deletion, light and dark themes, and export back to Excel.
Try the HypoNum beta
Try the beta and share your feedback with us.